
Table of Contents
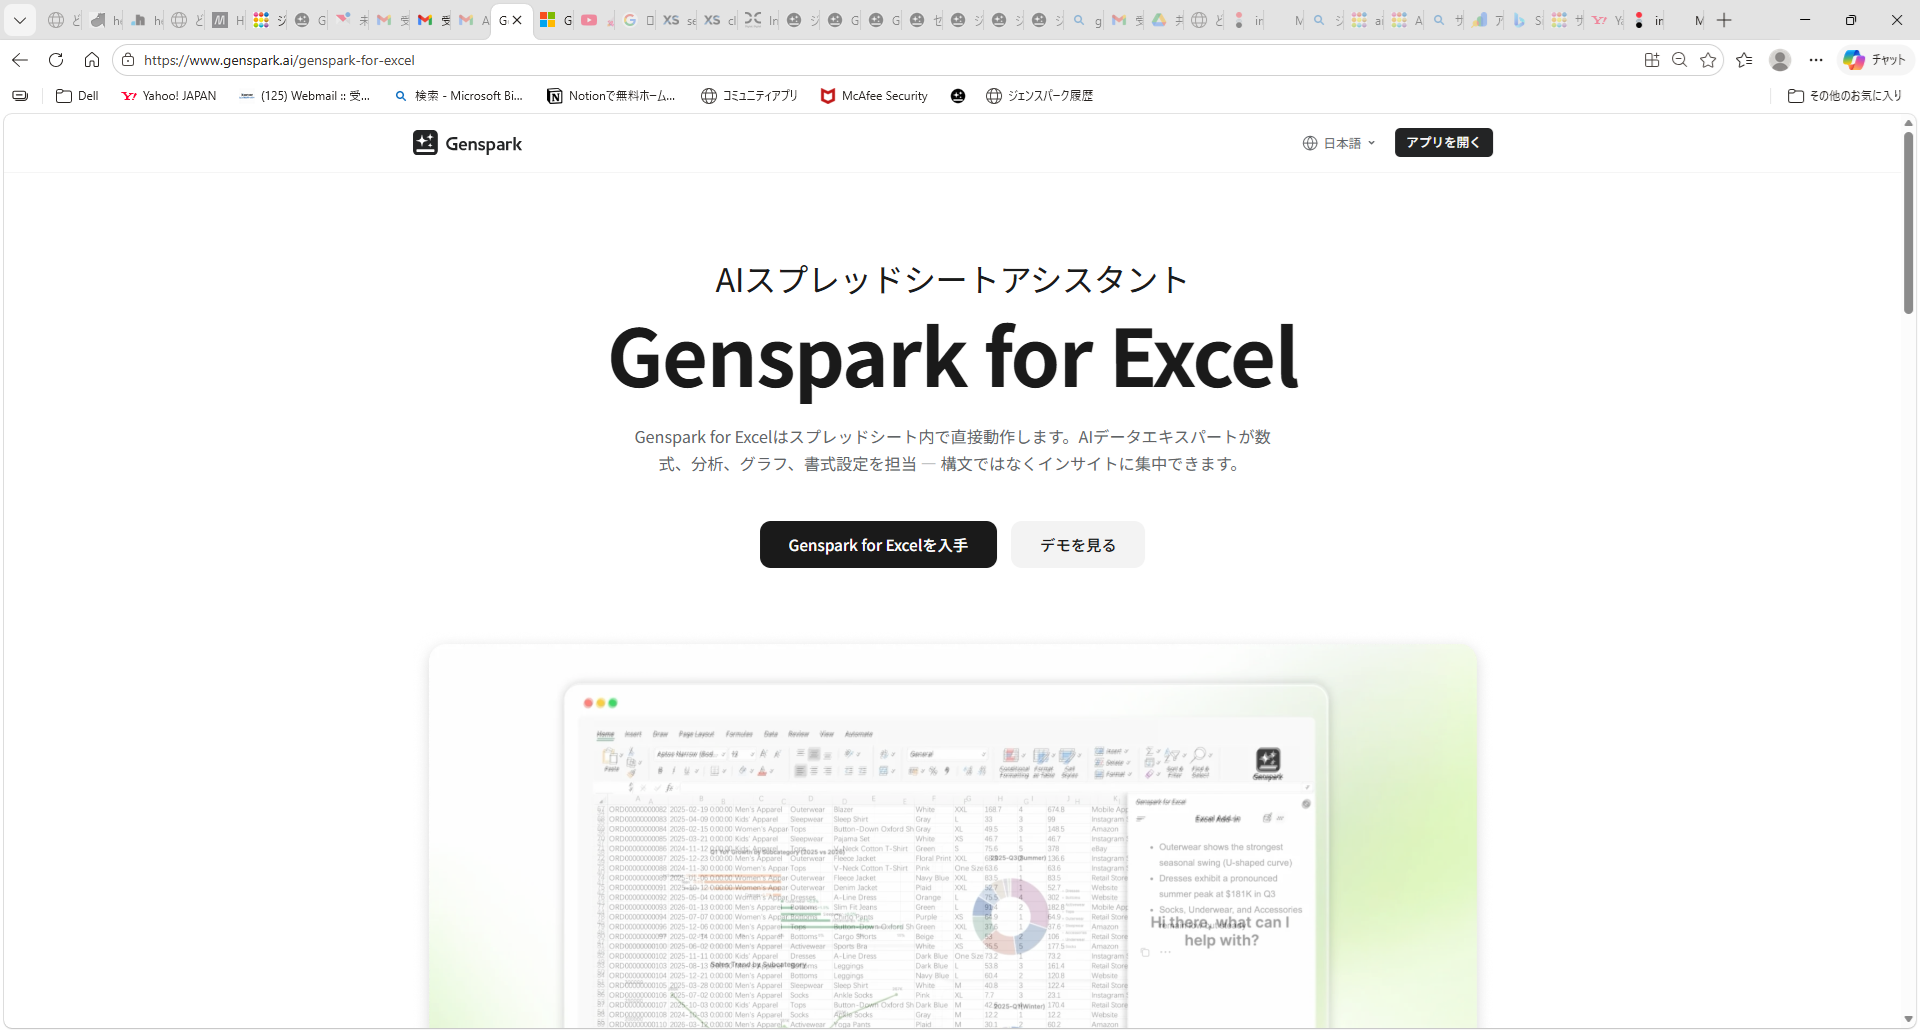
What Is Genspark for Excel?
I tried out Genspark for Excel, a new feature introduced in Genspark 4.0. It works as an Excel add-in, embedding Genspark's AI directly into your spreadsheet so you can handle data operations, analysis, and chart creation simply by typing instructions into a chat panel.
Install it here: Genspark for Excel Install Page
Why It's Better Than the Browser Version
Personally, I never really felt motivated to edit Excel files using the browser version of Genspark. The reason was simple: you had to upload the file, then separately open Excel, and then type out instructions like "in sheet X, column Y, please do Z" — which always felt like too much friction.
The Excel add-in solves this completely. You can look at your actual spreadsheet and give instructions directly in the side panel in real time. Just point at your data and say "turn this into a chart" or "give me the mean and standard deviation" — everything happens right in front of you.
How to Install
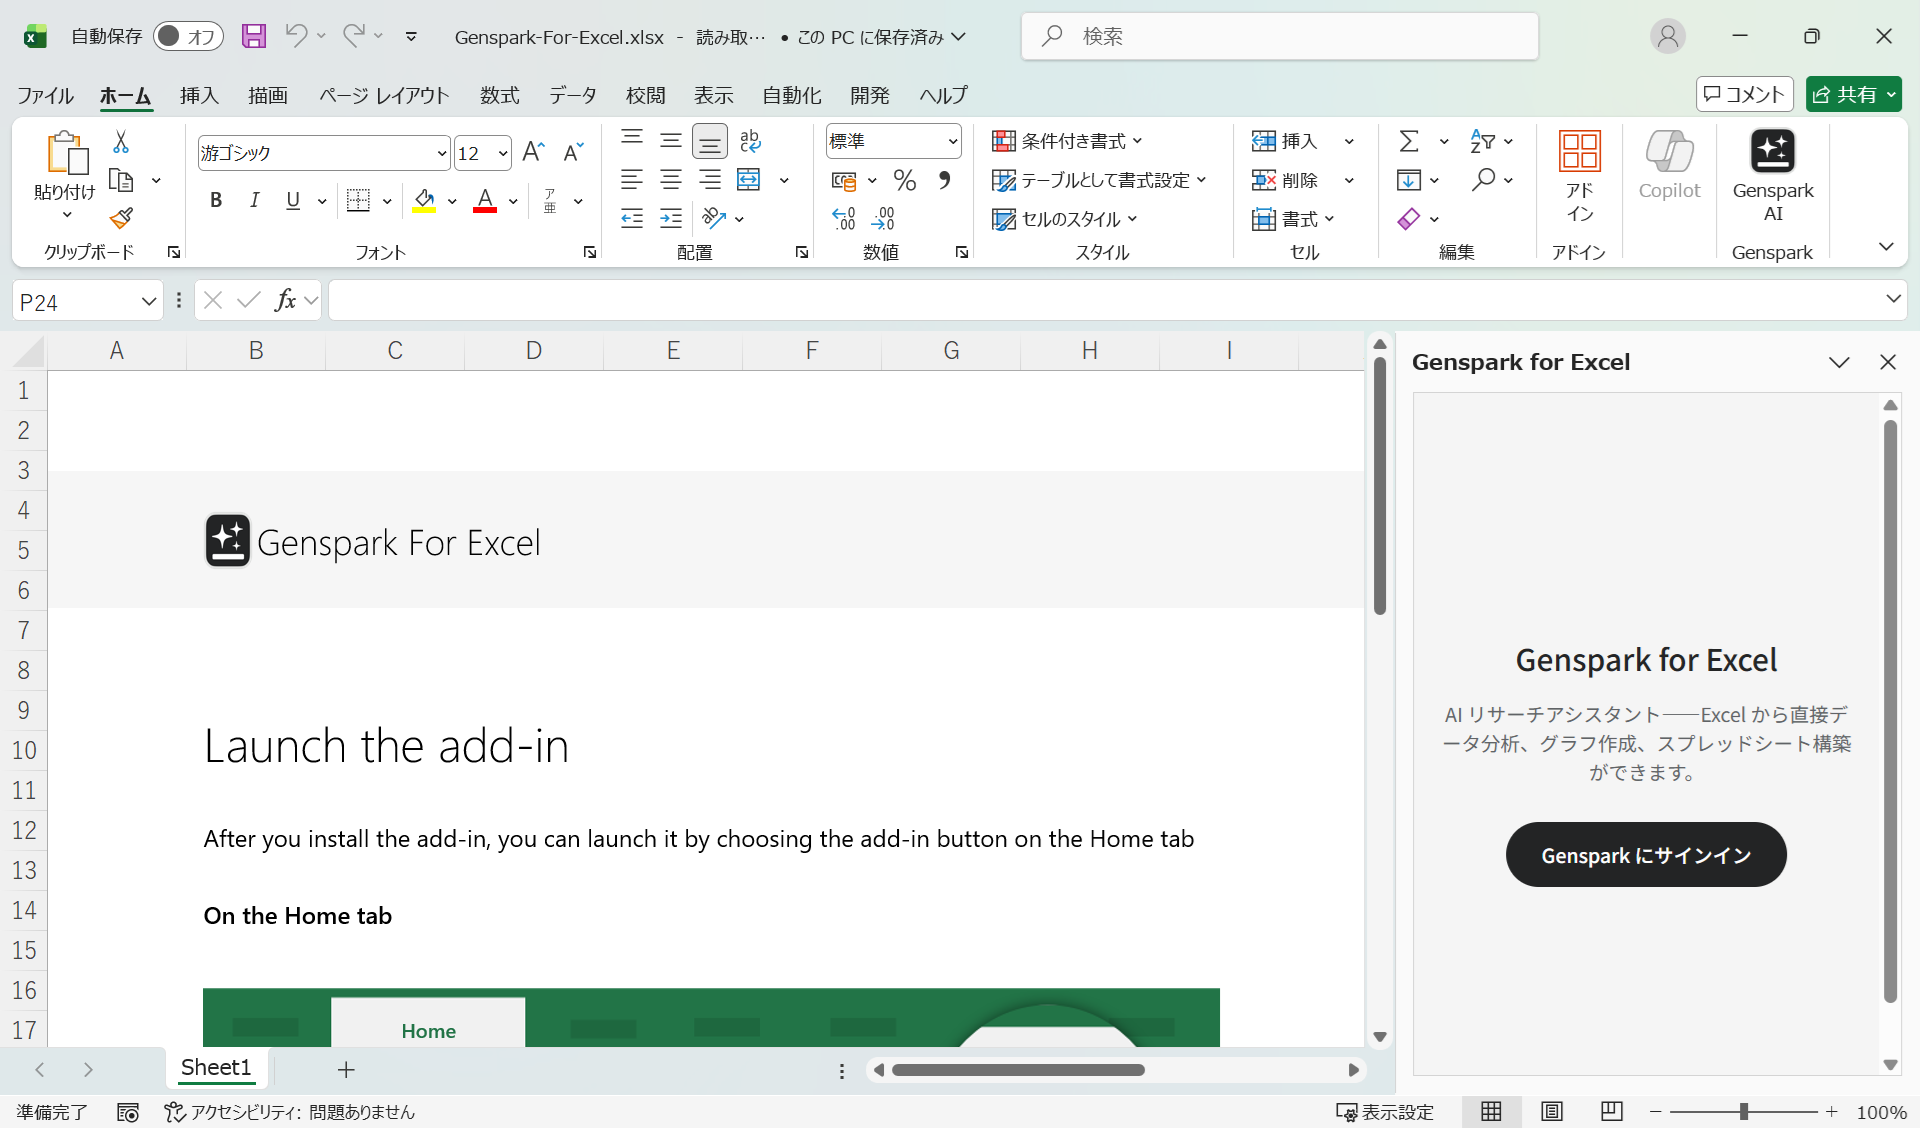
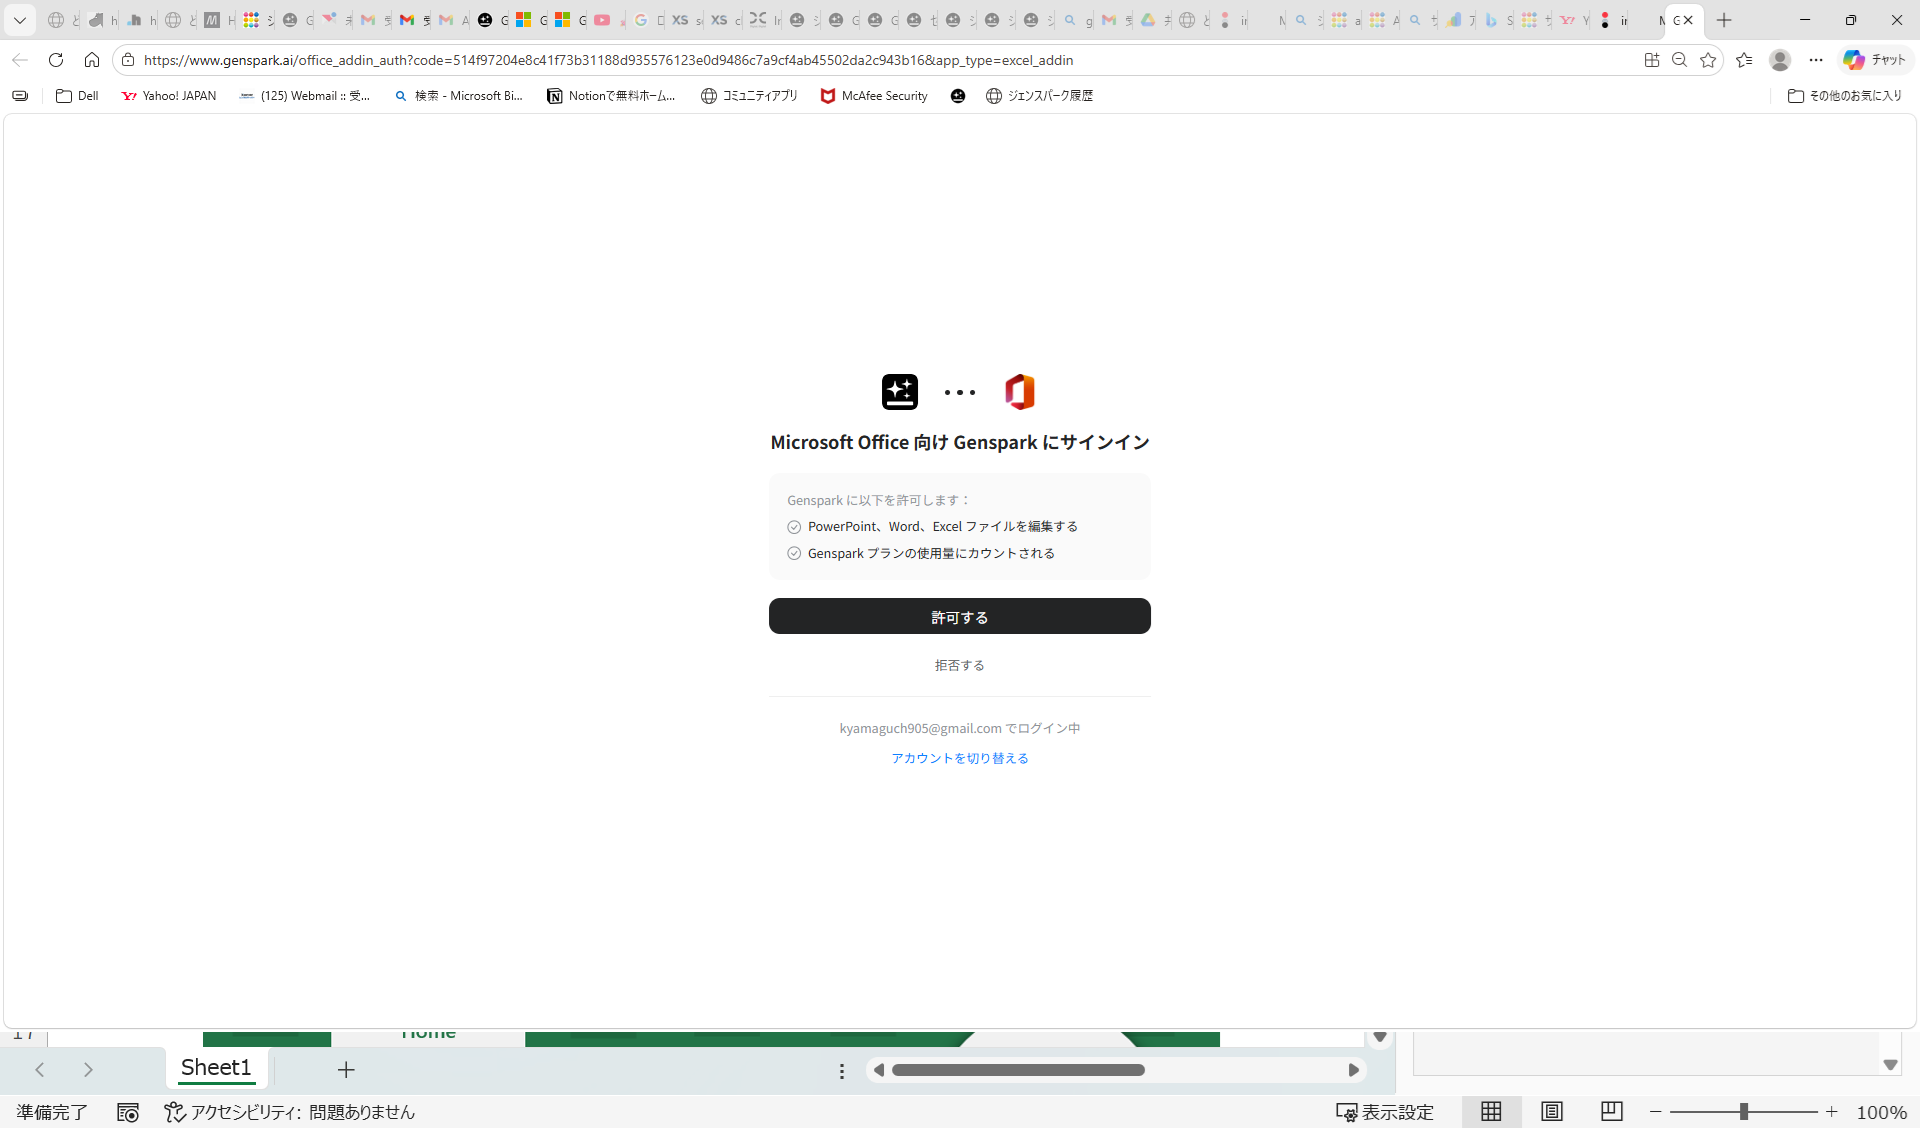
Installation is done through Microsoft AppSource. You'll need your Genspark account and a Microsoft account. The initial setup takes a little effort, similar to the PowerPoint add-in, but once configured you can launch it directly from the Excel ribbon.
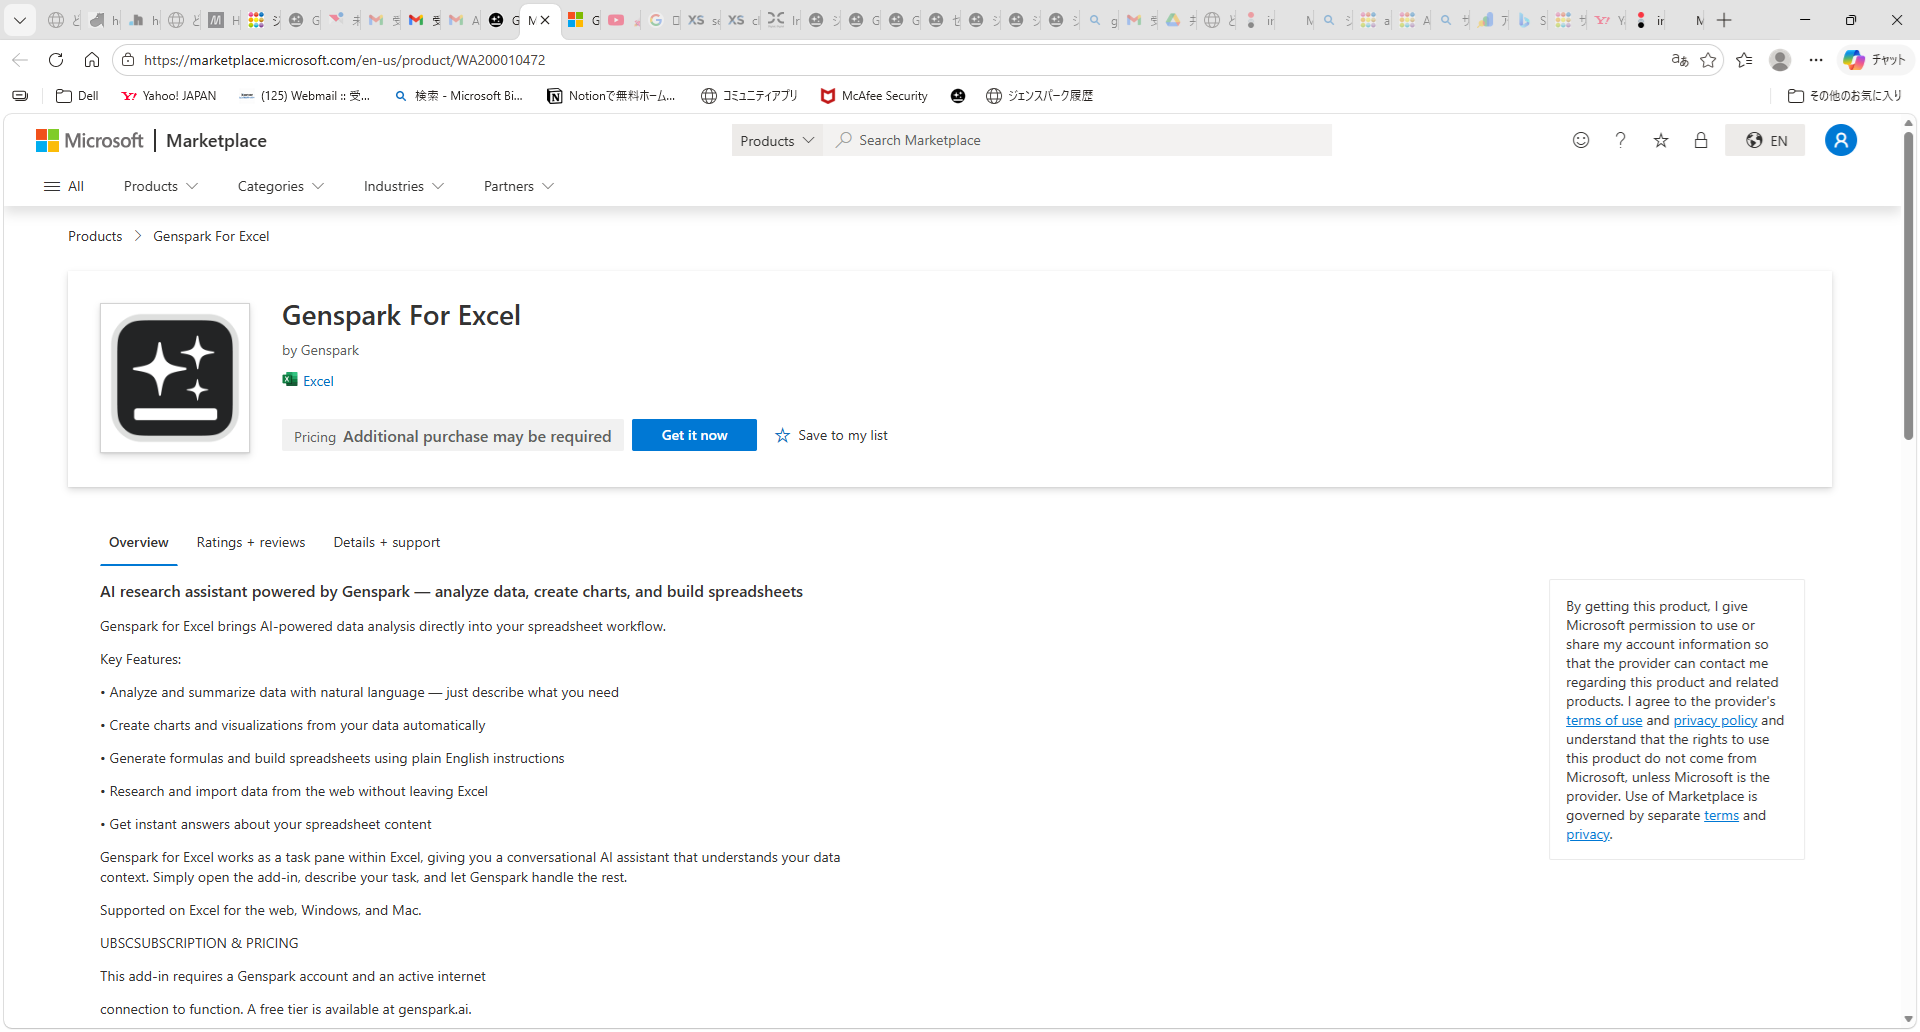
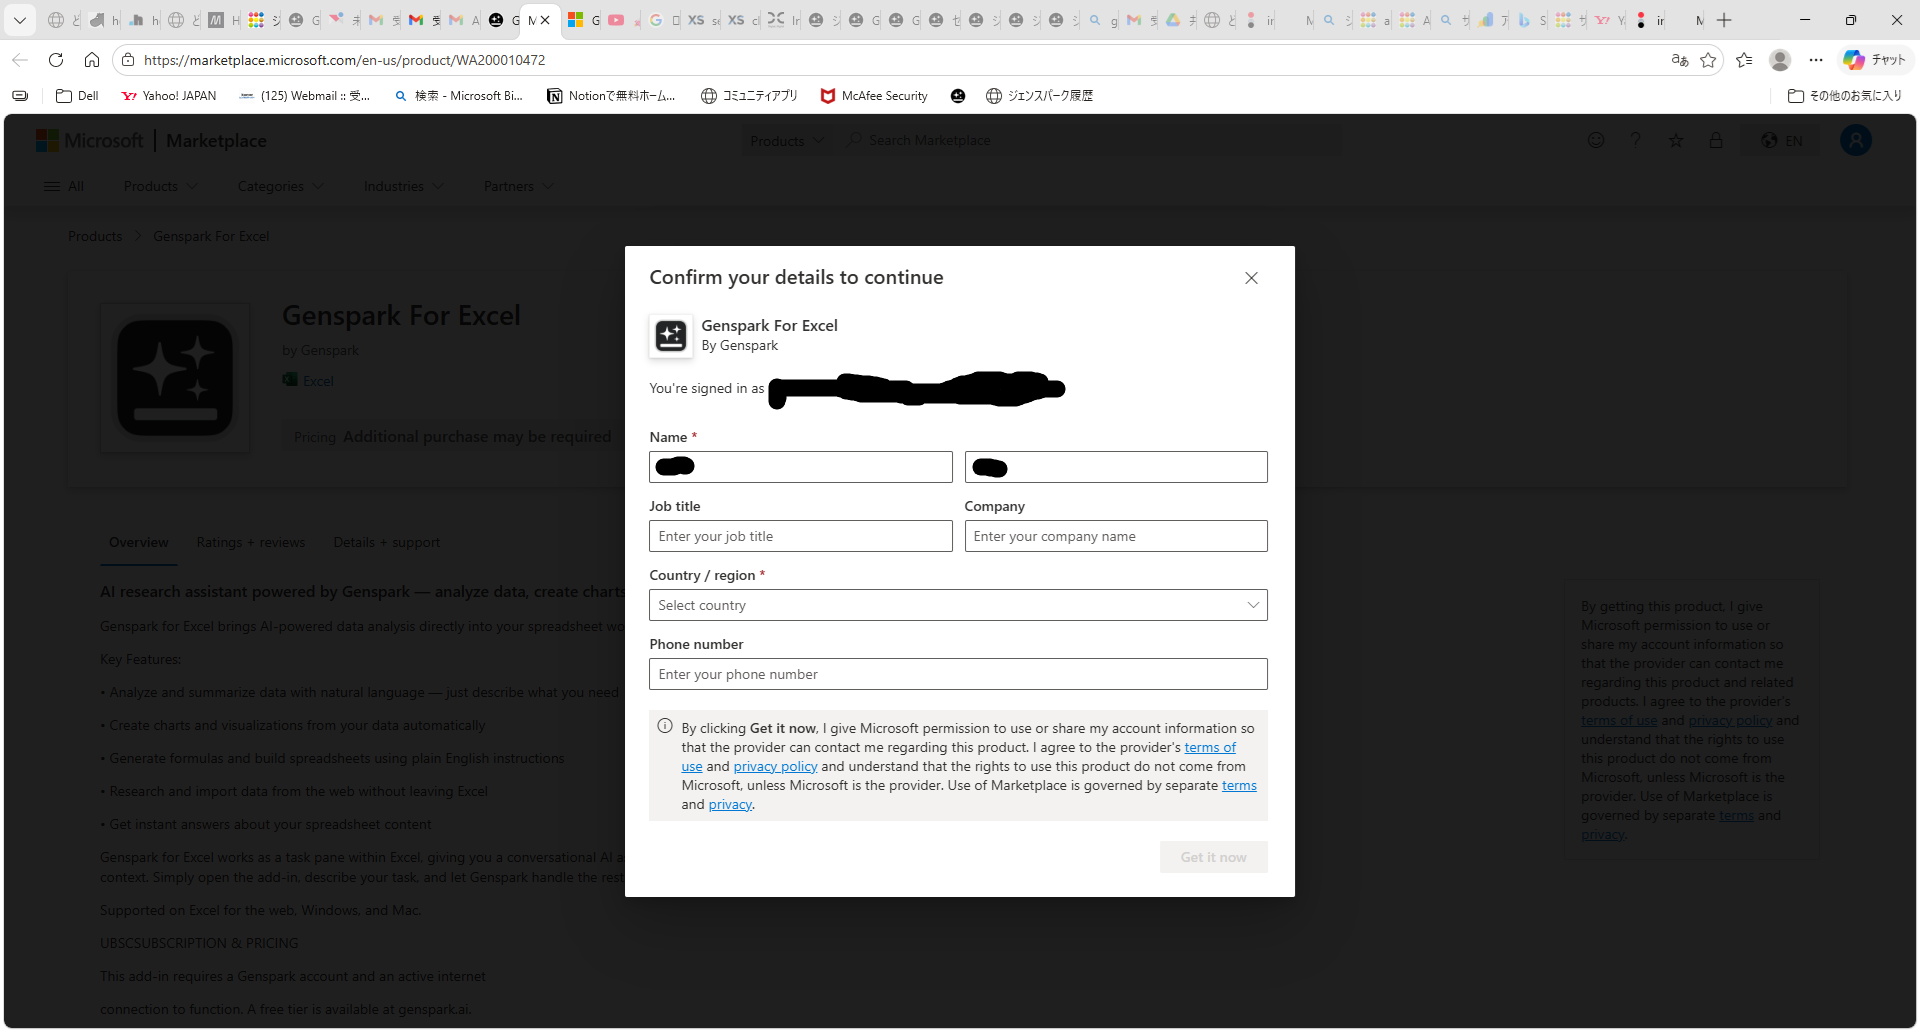
Clicking "Get it now" will prompt you to sign in to your Microsoft account and confirm your details.
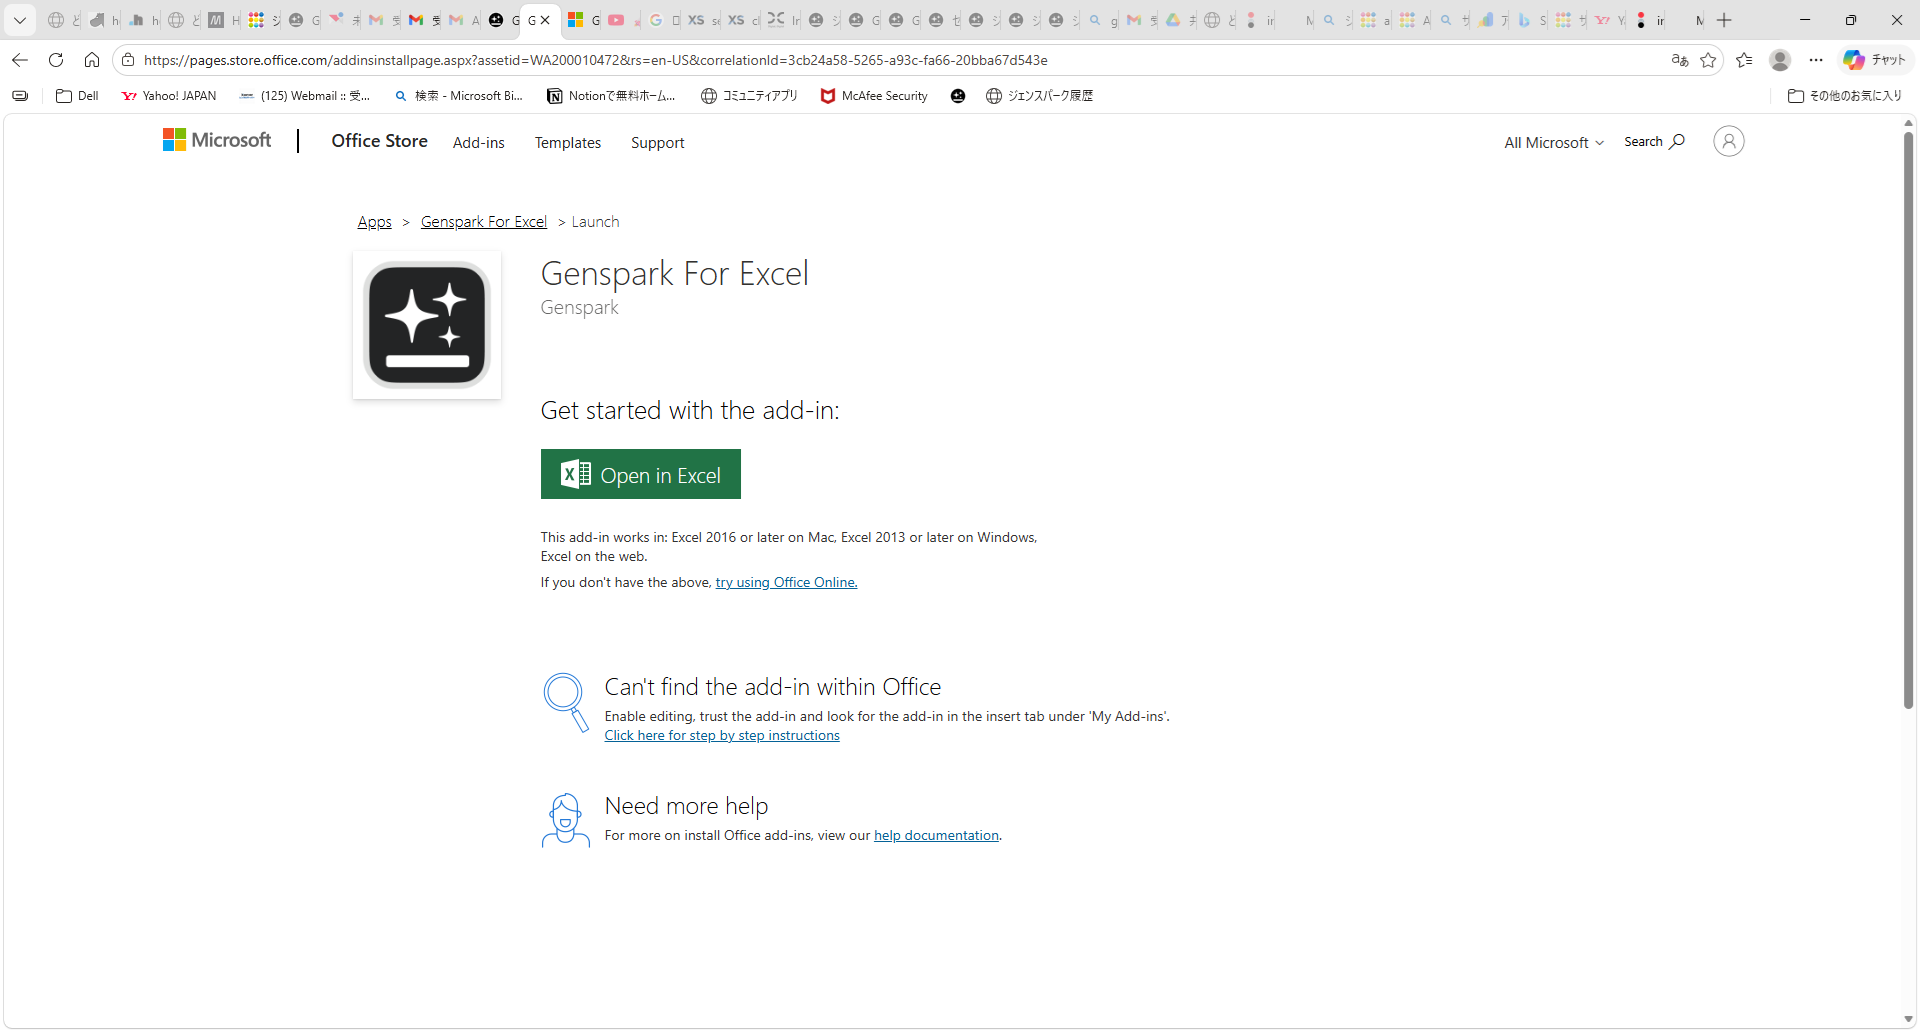
Once installation is complete, click "Open in Excel" to launch Excel with the add-in ready to use.
① Click "Get it now" on AppSource → ② Sign in to Microsoft account and confirm details → ③ Click "Open in Excel" → ④ Launch the add-in from the "Genspark" button in the Excel ribbon → ⑤ Sign in to your Genspark account
Hands-On: Gaussian Distribution & Histogram Creation
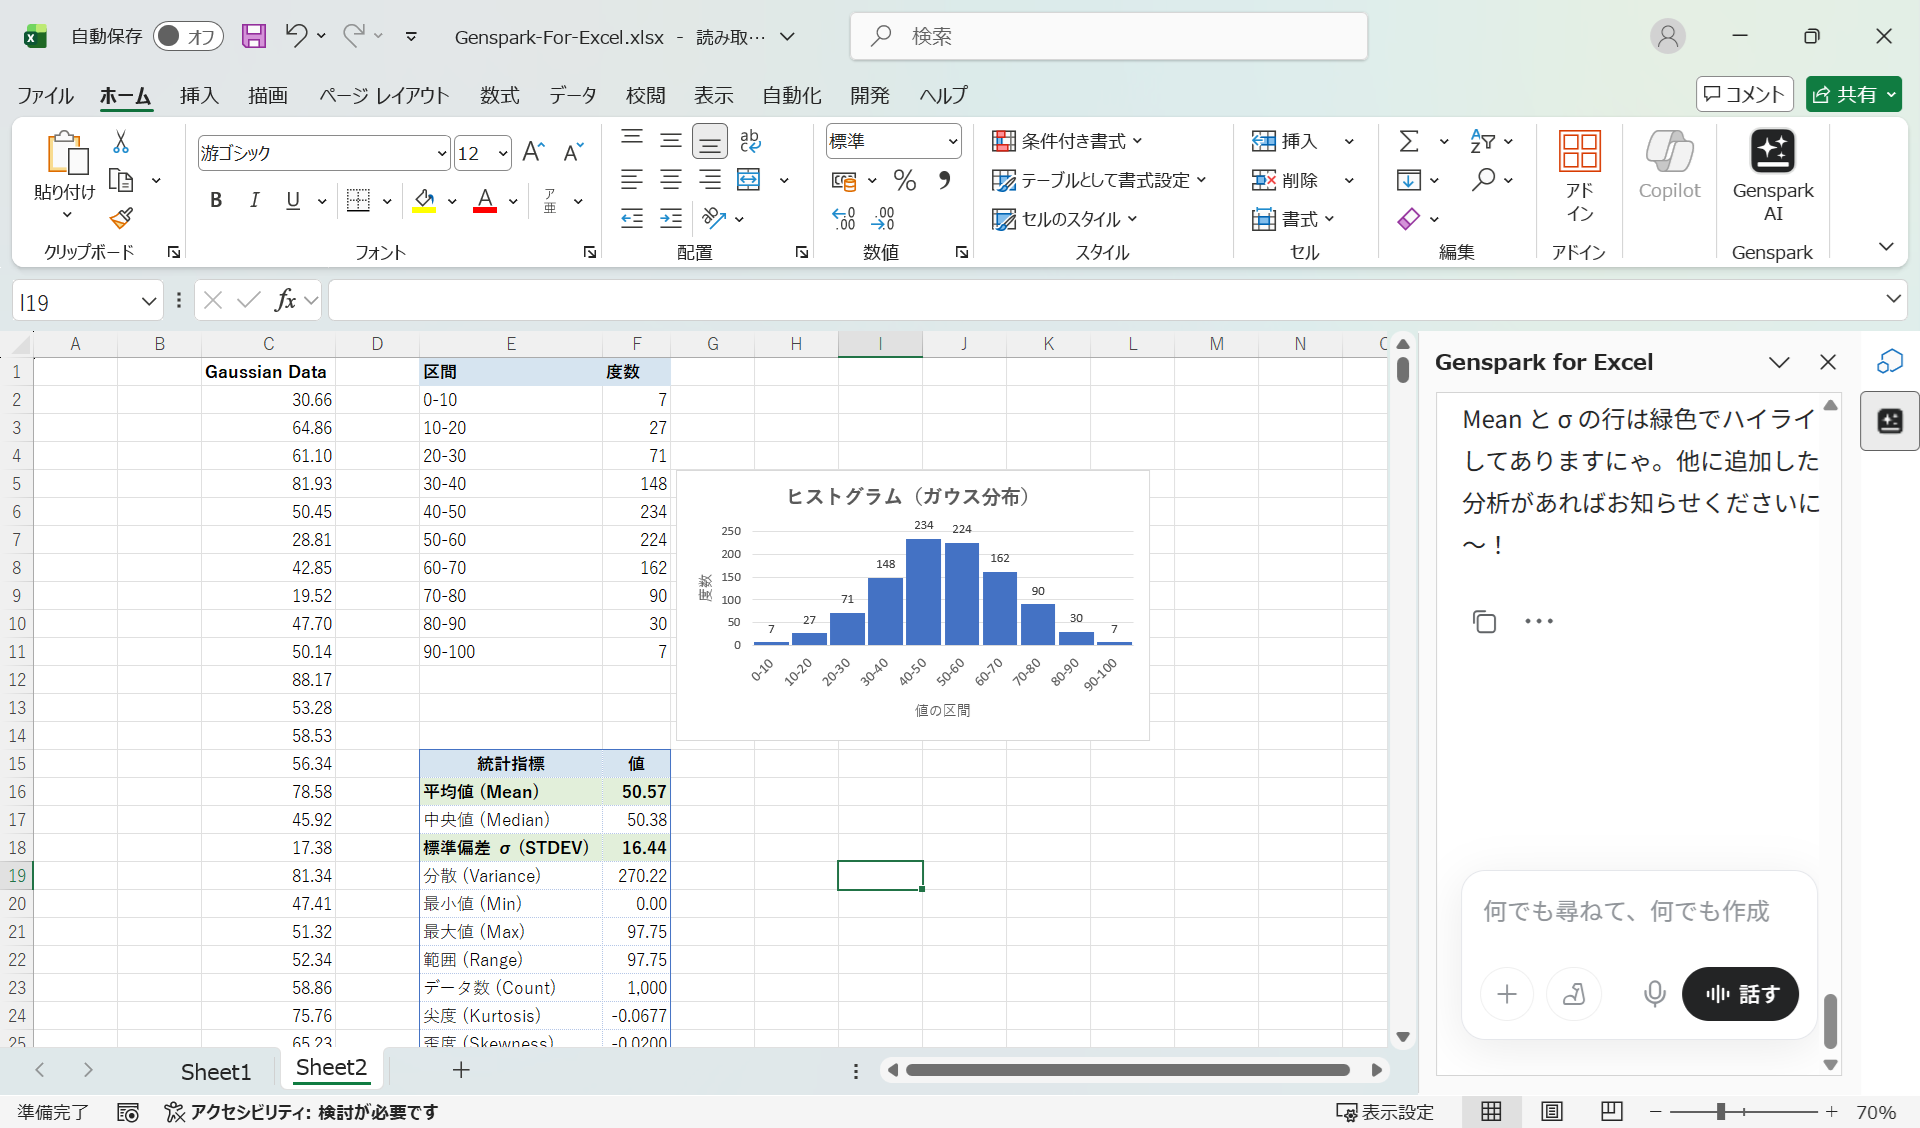
I ran a quick test to see what the add-in could do. First, I asked it to generate 1,000 data points following a Gaussian distribution, then instructed it to create a histogram from that data.
① "Generate 1,000 data points with a Gaussian distribution."
② "Create a histogram from this data."
③ "Calculate the mean, standard deviation, variance, and other key statistics."
④ "Analyze the goodness of fit to a Gaussian distribution."
Honestly, I always forget the functions needed to build a histogram and end up looking them up every time. Being able to get a complete histogram with a single chat instruction is a huge time-saver. On top of that, extracting statistics and running a distribution fit analysis all happened in the same conversation — no formula hunting required.
You can download the actual Excel file generated during this session.
Summary
Genspark for Excel is a highly recommended add-in for anyone who works regularly in Excel.
Genspark for Excel Install Page
- Work directly in Excel with a side chat panel — far more practical than the browser version
- Data generation, chart creation, and statistical analysis all done via chat instructions
- No need to look up functions — just describe what you want
- Supports advanced tasks like macro creation and distribution fit analysis
- Dramatically expands what's possible in Excel
Also check out Genspark for PowerPoint, another new feature from Genspark 4.0. For a broader overview, see Everything Genspark Can Do and How to Get Genspark Credits.
For pricing details: Genspark Official Pricing